Table of Contents
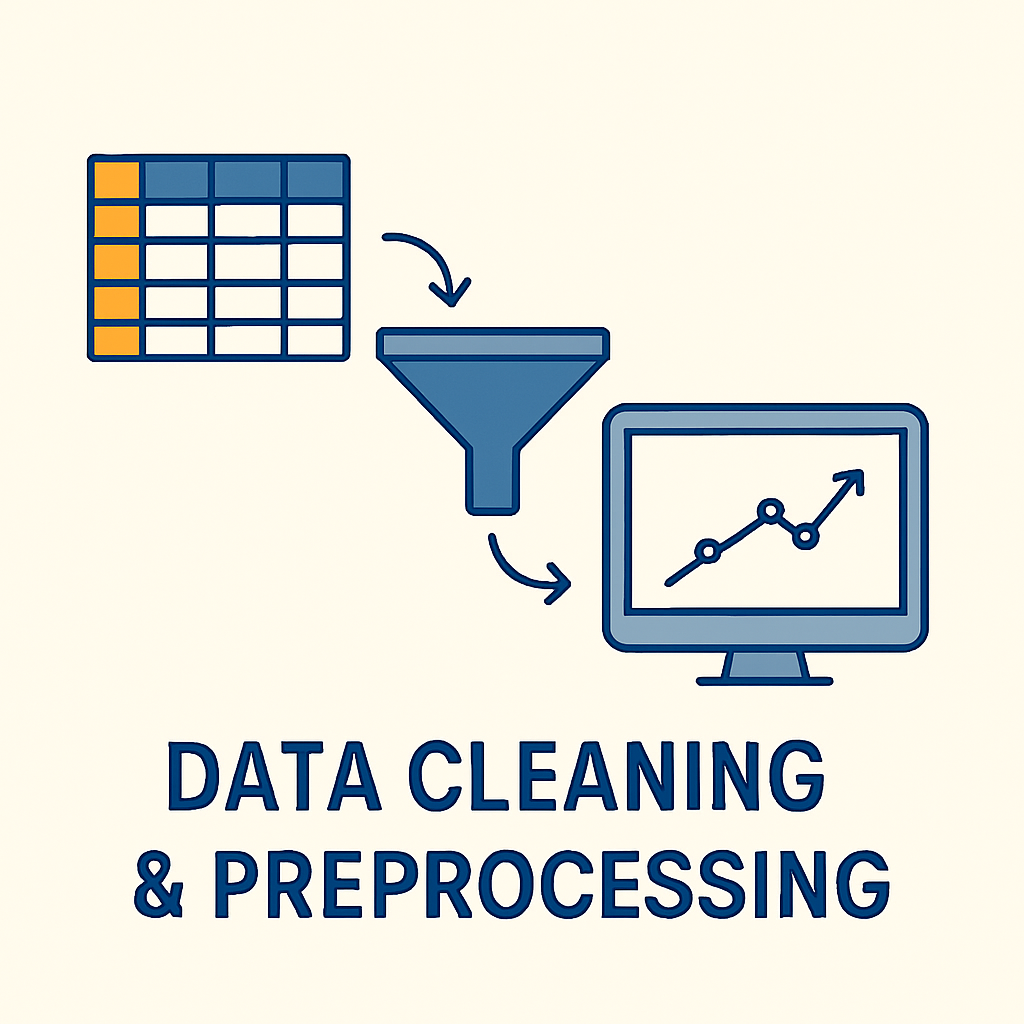
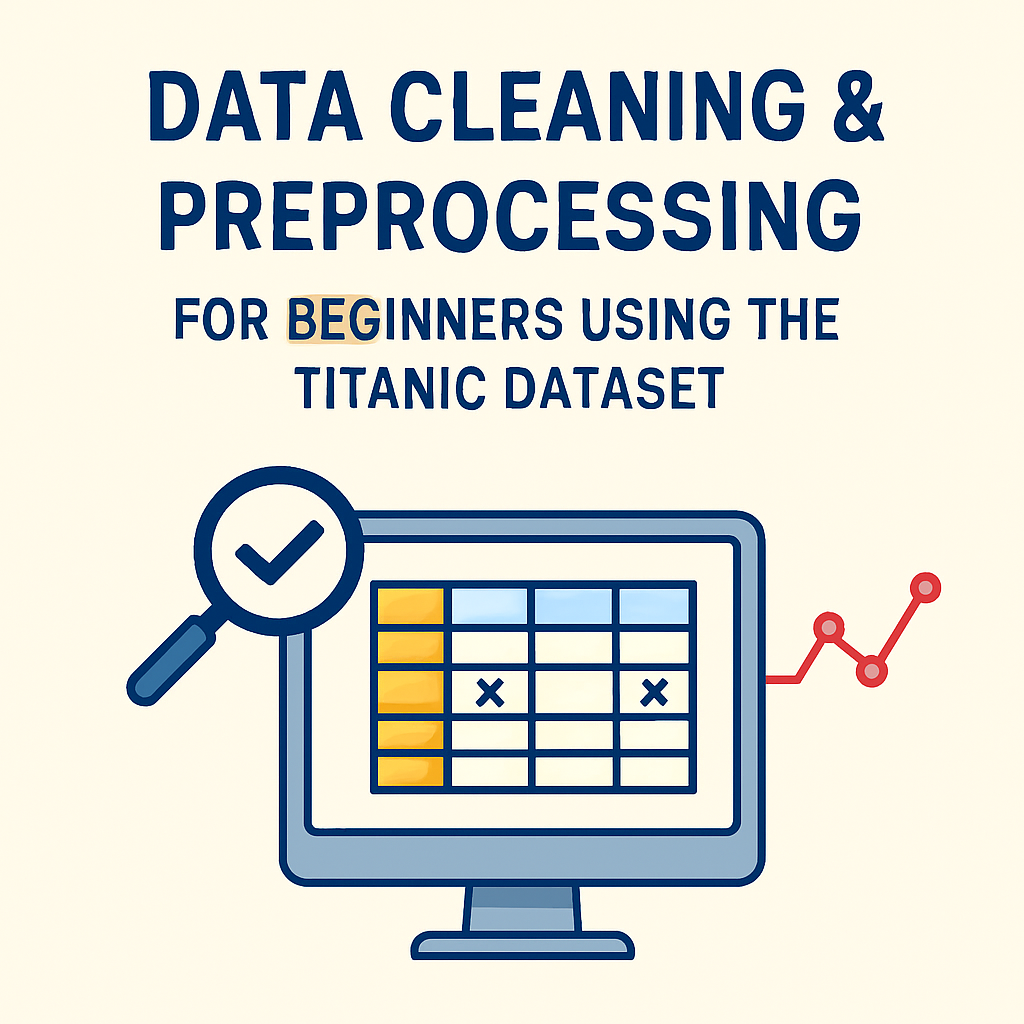
Data Cleaning with Titanic Dataset is one of the best ways for beginners to master essential preprocessing skills for machine learning. In this post, I’ll guide you through a complete, beginner-friendly process of data cleaning with the Titanic dataset, one of the most famous datasets in data science.
When you’re just getting started with machine learning or data science, one of the most important skills you’ll need is data cleaning and preprocessing. In this post, I’ll walk you through a complete beginner-friendly guide using the Titanic dataset, one of the most popular datasets used in data science.
By the end of this guide, you’ll understand:
What data cleaning is and why it’s necessary.
How to handle missing values.
How to encode categorical variables.
How to scale numerical values.
How to prepare your dataset for machine learning models.
You’ll also find a GitHub link to the full code and a PDF of my handwritten notes.

Real-World Importance of Data Cleaning
In the real world, analysts spend 60–80% of their time cleaning data. Why?
In real-world projects — whether it’s data cleaning with Titanic dataset examples or complex enterprise systems — analysts spend 60–80% of their time cleaning data.
- Clean data = better predictions
- Saves time during model evaluation
- Helps uncover hidden patterns
Why Data Cleaning with Titanic Dataset is a Must for Beginners
Raw data is often messy — it can contain missing values, inconsistent formats, and irrelevant information. If we feed such data directly into a machine learning model, the results will be inaccurate or misleading. That’s why data preprocessing is the foundation of any good data project.
Dataset Used: Kaggle Titanic Dataset
We’re using the Titanic dataset from Kaggle. It contains information about passengers such as:
Age
Sex
Ticket Fare
Survival status
Embarkation point
You can download the dataset from Kaggle or load it using seaborn for quick testing.
Steps for Data Cleaning and Preprocessing
Here’s a breakdown of the key steps and what each line of code does.
1. Import Libraries
import pandas as pd

import numpy as np

import seaborn as sns

import matplotlib.pyplot as plt
We use pandas for data manipulation, numpy for numerical operations, seaborn and matplotlib for visualization.
2. Load the Data
df =pd.read_csv('titanic.csv')We load the Titanic dataset from Seaborn. If you’re using Kaggle, use pd.read_csv(“titanic.csv”).
3. Understand the Data
df.info()

df.describe()

df.head()
These functions help you understand the structure, summary statistics, and first few rows of the dataset.
4. Handle Missing Values
df['age'].fillna(df['age'].median(), inplace=True)

df.drop(columns=['deck'], inplace=True)

df.dropna(subset=['embarked'], inplace=True)
We:
Fill missing age values with the median age.
Drop the deck column (too many missing values).
Remove rows where embarked is missing.
5. Encode Categorical Variables
Label Encoding sex:
df['sex'] = df['sex'].map({'male': 0, 'female': 1})We convert male and female into 0 and 1. This makes it machine-readable.
One-Hot Encoding embarked:
df = pd.get_dummies(df, columns=['embarked'], drop_first=True)This turns the embarked column into binary columns (e.g., embarked_Q, embarked_S).
We use drop_first=True to avoid multicollinearity — which happens when one column can be perfectly predicted from the others.
6. Feature Scaling
from sklearn.preprocessing import StandardScaler

scaler = StandardScaler()

df[['age', 'fare']] = scaler.fit_transform(df[['age', 'fare']])
We scale age and fare so that they have a mean of 0 and standard deviation of 1. This helps many ML algorithms perform better.
7. Visualizing the Data
sns.heatmap(df.corr(), annot=True)

plt.title('Correlation Matrix')

plt.show()
Correlation heatmaps can help you understand relationships between variables.
Final Thoughts
Cleaning and preprocessing the dataset is not optional — it’s a must if you want your machine learning models to be accurate.
You can now proceed to build models using libraries like scikit-learn or dive deeper into EDA (Exploratory Data Analysis).
Git Hub Repository
GitHub Repository – Full code and dataset.
My Handwritten Notes – PDF notes to help you revise quickly
Kaggle Titanic Competition Page
Kaggle Titanic Competition Page – Explore more about the Titanic dataset.
Understanding get_dummies and map in Pandas
Understanding get_dummies and map in Pandas – Learn how these functions work in detail.
You May Also Like
If you’re enjoying this beginner-friendly Java series, here are a few of my other helpful posts that you might find useful:
- Java Learning Roadmap 2025 – From Zero to Pro
A step-by-step guide to how I plan to learn Java in 2025, perfect for beginners like me. - Aptitude Tricks for Beginners – Easy Mental Math Techniques
Quick tricks for multiplication, LCM, squaring, and cubes — useful for placement and coding exams. - Types of Nouns in English Grammar – Simple Explanation with Examples
Learn all types of nouns clearly with examples — great for communication skills and competitive exams. - Java Introduction to Programming: My Exciting Day 1 Journey from Zero to Beginner


Pingback: History of Java Programming Language: 8 Powerful Facts from Creation to Modern Features - Monika's Study Space
Pingback: First Java Program – 7 Key Concepts Every Beginner Must Know - Monika's Study Space
Pingback: IntelliJ IDEA Installation Guide: Easy and Complete Setup for a Smooth Coding Experience - Monika's Study Space
Pingback: Install Eclipse IDE for Java: Complete Step-by-Step Guide for Beginners - Monika's Study Space
Pingback: Object Oriented Programming in Java: Simple Guide with Examples for Beginners - Monika's Study Space
Pingback: How to Install VS Code for Java and Create Your First Java Program (Step-by-Step Guide) - Monika's Study Space
Pingback: Full Stack Developer Roadmap: Zero to Job Ready (6–8 Months Plan) - Monika's Study Space
Pingback: Git and GitHub Explained: Simple Guide for Beginners - Monika's Study Space
Pingback: MERN Stack: A Beginner’s Guide to Web Development and Internet Fundamentals - Monika's Study Space